

Data has become an important part of modern business. Companies collect information from
websites, applications, customer transactions, social media, and internal systems. However,
collecting data is only the first step. Businesses need to understand that data to identify trends,
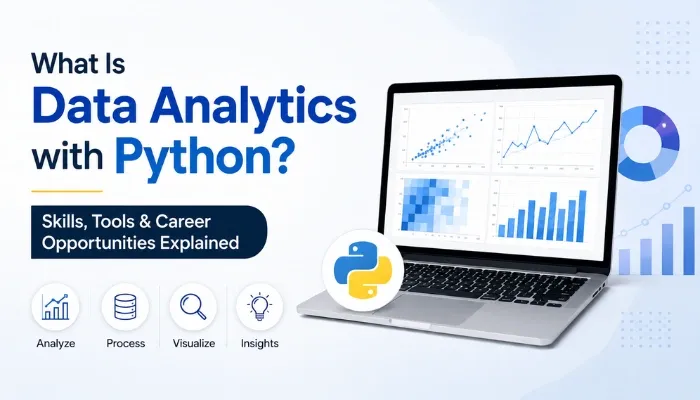
measure performance, understand customers, and make better decisions. This is where data analytics becomes important. Data Analytics with Python combines analytical techniques with Python programming to work with data efficiently. If you are wondering what data analytics with Python is, it is the process of collecting, cleaning, exploring, analyzing, and visualizing data using Python and its specialized libraries.
Python has become a popular choice for data analytics because it is relatively easy to learn and
provides a large ecosystem of tools. It can help beginners understand analytical concepts while also
providing advanced capabilities for professionals. In this blog, we will explore what data analytics
in Python is, the skills and tools required, the data analytics with Python syllabus, career opportunities,
interview questions, and how you can start learning this field.
What Is Data Analytics with Python?
Data Analytics with Python refers to using Python programming and its libraries to examine datasets
and extract useful information from them. The process can involve collecting data, removing errors,
organizing information, performing calculations, identifying patterns, and presenting results through
visualizations.
For example, an e-commerce company may have thousands of customer transactions. A data analyst
can use Python to determine which products generate the highest sales, which months perform
better, and how customer purchasing patterns change over time. The objective is not simply to
process numbers. Data analytics helps convert raw information into meaningful insights that
businesses can use for planning and decision-making.
So, when people ask what Python is in data analytics, they are essentially asking how Python is used
as a programming and analytical tool to work with datasets. Python provides libraries and functions
that make many data-related tasks faster and easier to manage. The typical analytics process starts
with raw data. Analysts clean and organize that data before exploring it. They then use statistical
techniques and visualizations to identify important patterns and finally communicate the findings.
This makes Python useful across different stages of the analytical process rather than being limited
to one specific task.
Why Is Python Used for Data Analytics?
Python is widely used for data analytics because it combines simple programming syntax with
powerful data-processing capabilities. Beginners can learn the fundamentals without dealing with
overly complicated syntax, while experienced professionals can use Python for more advanced
analytical workflows.
Another major advantage is its library ecosystem. Tools such as Pandas, NumPy, Matplotlib, and
Seaborn provide ready-to-use functionality for working with numerical data, structured datasets,
statistical analysis, and visualization. Python can also automate repetitive tasks. Instead of manually
processing the same spreadsheet every week, an analyst can create a Python workflow that performs
the required operations automatically.
Python is also flexible enough to connect with databases, APIs, spreadsheets, cloud platforms, and
other technologies. This makes it useful when data comes from multiple sources and needs to be
processed within a single analytical workflow. For these reasons, Python is used by organizations
across industries including finance, e-commerce, healthcare, marketing, education, retail, and
technology.
Skills and Tools Required for Python Data Analytics
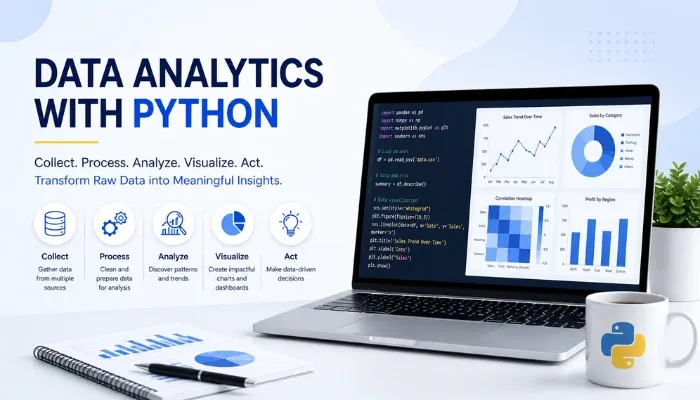
Learning Python syntax is only one part of becoming a data analyst. You also need to understand how
data is structured, how it should be cleaned, how statistical concepts are applied, and how analytical
findings can be communicated clearly. Python fundamentals are a good starting point. You should
understand variables, data types, operators, conditional statements, loops, functions, and common
data structures such as lists, tuples, sets, and dictionaries.
After learning the basics, Pandas and NumPy become important. NumPy is mainly used for numerical
operations and arrays, while Pandas is widely used for working with structured and tabular data.
Pandas provides features for filtering, sorting, grouping, merging, transforming, and analyzing
datasets. These capabilities make it one of the most important libraries for Python data analytics.
Data cleaning is another essential skill. Real-world datasets often contain missing values, duplicate
records, incorrect formats, and inconsistent information. Analysts need to identify these issues and
prepare the data before performing meaningful analysis. Statistics also plays an important role.
Concepts such as mean, median, mode, variance, standard deviation, probability, and correlation
help analysts understand what the data is actually showing.
Data visualization is equally important because analytical results are easier to communicate through
appropriate charts. Matplotlib and Seaborn can be used to create visual representations of trends,
comparisons, distributions, and relationships. SQL is another valuable skill for data analysts. Many
organizations store information in relational databases, so knowing how to retrieve and filter data
using SQL can complement your Python analytics skills.
Data Analytics with Python Syllabus
If you are planning to learn this field through a structured course, understanding the data analytics
with Python syllabus can help you know what skills you will develop. A comprehensive course
generally begins with Python programming fundamentals. This provides the foundation required to
work with data and understand how Python-based analytical operations work.
The syllabus usually progresses toward NumPy and Pandas for numerical computing and data
manipulation. Learners should understand arrays, DataFrames, filtering, sorting, grouping, merging,
and other common data operations. Data cleaning and exploratory data analysis are also important
parts of the learning path. These topics teach learners how to identify missing information, duplicate
records, unusual values, and patterns within datasets.
Statistics and visualization are typically included as well. Learners may work with descriptive statistics,
correlation, distributions, charts, graphs, and other techniques for understanding and communicating
analytical findings. A practical syllabus may also introduce SQL and real-world datasets. Working with
realistic data helps learners understand how the concepts they study are applied to actual business
problems.
| Module | Key Topics |
| Python Fundamentals | Variables, data types, conditions, loops, functions |
| Python Data Structures | Lists, tuples, sets, dictionaries |
| NumPy | Arrays and numerical operations |
| Pandas | DataFrames, filtering, sorting, grouping |
| Data Cleaning | Missing values, duplicates, inconsistent data |
| Exploratory Data Analysis | Patterns, trends, distributions |
| Statistics | Mean, median, variance, correlation |
| Data Visualization | Charts, graphs, Matplotlib, Seaborn |
| SQL | Queries, filtering, joins, aggregation |
| Practical Analytics | Real-world datasets and business scenarios |
The exact data analytics with Python syllabus can differ between training programs. However, a good
learning program should combine concepts with hands-on practice so that learners understand how
to apply their knowledge.
How Python Data Analytics Works
The Python data analytics process generally begins with defining a problem. Before writing code, an
analyst needs to understand what question the data should answer. For example, a business may
want to understand why its sales have declined. This question determines what data needs to be
collected and which analytical methods may be useful.
The next step is collecting data. Information may come from databases, spreadsheets, APIs,
applications, websites, or internal business systems. Once the data is collected, it needs to be cleaned.
Analysts may remove duplicate records, handle missing values, correct data types, and standardize
inconsistent information. After cleaning, analysts explore the dataset to understand its structure and
identify initial patterns. Pandas, statistics, and visualization tools can be used during this stage. The
next stage is analysis. Depending on the problem, an analyst may calculate averages, compare groups,
identify trends, examine correlations, or perform other appropriate analytical techniques.
Visualization then helps communicate important findings. A well-designed chart can make a trend or
comparison easier to understand than a large table of numbers. Finally, the analyst interprets the
results and communicates the findings. The purpose is to explain what the data means and how the
insight may help answer the original business question.
Applications and Career Opportunities
Python data analytics is used in many industries because organizations across sectors generate and
depend on data. In e-commerce, analysts can study customer purchases, product performance,
conversion rates, and buying behavior. Retail businesses can analyze inventory, sales trends, seasonal
demand, and customer preferences.
Marketing teams can use analytics to understand campaign performance, website traffic, customer
segments, and engagement. Financial organizations can analyze transactions, revenue trends, and
customer activity. Healthcare and education organizations can also use analytics to examine
operational and performance-related datasets. The specific use of analytics depends on the
organization’s goals and the type of data available.
Learning Python data analytics can also support several career paths. A person with the right skills
may pursue roles such as Data Analyst, Business Analyst, Reporting Analyst, Business Intelligence
Professional, or Data Visualization Analyst. With additional knowledge of statistics, machine learning,
and advanced Python, professionals can also move toward data science and other advanced data-
related roles. However, career growth depends on more than completing a course. Practical
knowledge, problem-solving ability, communication skills, and experience working with real datasets
are also important.
How to Start a Career in Data Analytics with Python
If you are a beginner, start by building a strong foundation in Python programming. Learn basic syntax
and practice working with common data structures before moving to specialized analytics libraries.
Next, focus on NumPy and Pandas. Practice loading datasets, filtering records, handling missing
values, grouping information, and creating calculated fields.
Once you are comfortable with data manipulation, learn the basics of statistics and data visualization. You
should be able to understand what your calculations mean and communicate the results through
suitable charts. SQL should also be part of your learning path. Many data analyst roles involve working
with information stored in databases, so combining SQL with Python can make your skill set more
practical.
Most importantly, practice with real datasets. Try answering questions from sales, marketing,
customer, financial, or other publicly available datasets. You should also develop communication
skills. A good data analyst needs to explain findings in simple language and connect analytical results
with business objectives.
Future Scope of Data Analytics with Python
The demand for data-related skills continues to grow as businesses generate increasing amounts of
digital information. Python also has strong connections with artificial intelligence, machine learning,
automation, and predictive analytics. This gives professionals opportunities to expand their
knowledge after building a foundation in data analytics.
For beginners, it is better to focus on the fundamentals before moving into advanced technologies.
Strong knowledge of Python, data manipulation, statistics, visualization, and SQL can provide a
foundation for further learning. As your experience grows, you can explore areas such as machine
learning, business intelligence, predictive analytics, data engineering, or data science. The specific
direction you choose can depend on your interests, existing skills, and career goals.
Conclusion
So, what is data analytics with Python? It is the process of using Python and its libraries to collect,
clean, explore, analyze, visualize, and interpret data. Python provides a practical environment for
working with datasets and automating many repetitive analytical tasks. Tools such as Pandas, NumPy,
Matplotlib, and Seaborn make different stages of the analytics process easier to manage. If you want
to build a career in this field, focus on Python programming, data manipulation, statistics,
visualization, SQL, and practical problem-solving.
A structured data analytics with Python syllabus can help you develop these skills step by step and
prepare for different career opportunities in the growing data analytics field.
FAQs
- What is data analytics with Python?
Data analytics with Python is the process of using Python and its libraries to clean, process, analyze, visualize, and interpret data to find useful insights. - Is Python good for data analytics?
Yes. Python is widely used for data analytics because it is relatively easy to learn and provides
powerful libraries for data manipulation, analysis, visualization, and automation. - What should I learn first for Python data analytics?
Beginners should start with Python fundamentals and then learn NumPy, Pandas, data cleaning,
statistics, visualization, and SQL. - What is included in a data analytics with Python syllabus?
A typical syllabus covers Python programming, NumPy, Pandas, data cleaning, exploratory data
analysis, statistics, visualization, SQL, and practical data analysis. - Is Data Analytics with Python suitable for beginners?
Yes. Beginners can learn Python data analytics step by step by first understanding programming
fundamentals and then progressing toward data analysis and visualization. - What are common data analytics interview questions in Python?
Common questions cover Python basics, Pandas, NumPy, DataFrames, missing values, data cleaning, exploratory data analysis, statistics, and practical data-related scenarios. - What career opportunities are available after learning Python data analytics?
Career options can include Data Analyst, Business Analyst, Reporting Analyst, Business Intelligence Professional, and Data Visualization Analyst. Additional skills can lead to data science roles.